Swell animation from ENVISAT ASAR instrument
These beautiful "fireworks" are observations of swell waves generated by storms, using the ASAR instrument (in wave mode) from the ENVISAT satellite of the European Space Agency (ESA). The detected swell wave groups are propagated forwards and backwards in time, using the direction information of the wave spectra, in order to predict their location at various time steps and to produce these animations.
Application developed with the support of Boost-Technologies
SAR wave mode observations by ENVISAT are by nature discrete in time and space as the acquisition scenario corresponds to one observation every 100km along the satellite orbit. Therefore, at any time, only few observations of the swell field are available preventing from any analysis of the space/time evolution of storm generated swells. However, swell waves have the particular properties of having a very stable dominant frequency and direction in the absence of island refraction and strong surface currents. It is then possible, in most cases, to propagate the observation at one given time and space along the great circle at the group propagation speed. From these real observations, animation can be reconstructed in order to follow the track of these swell groups through the ocean.
Animations are currently processed over three different areas. They are updated every day, displaying swell observations from the last three days with a prediction to the next three days. The color is the wave length of the waves : it can be verified that waves with longer wave length propagate faster than waves with shorter wave length and therefore arrives sooner to the coast.
Click here to see the animation
Click here to see the animation
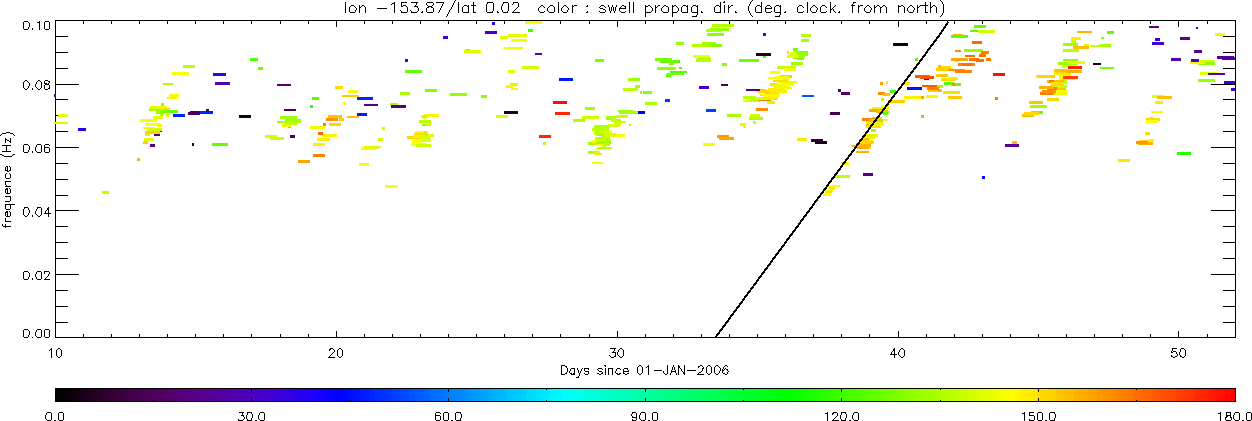
The applicability of such simple propagation method is supported by the comparison of propagated observations with buoys. The evolution of observed frequencies versus time from a distant storm at a given location (ridge analysis) is a very good indicator of the strength of the swell tracking methodology. Ridges observed at Christmas island buoy and from swell tracking are presented on . The ridge intersection with the X-axis indicates the time origin of the storm swell system and the slope the propagation speed. The excellent agreement between SAR derived and buoys ridge slopes justifies our simple group velocity propagation technique.