Sea Ice circulation in the north pole
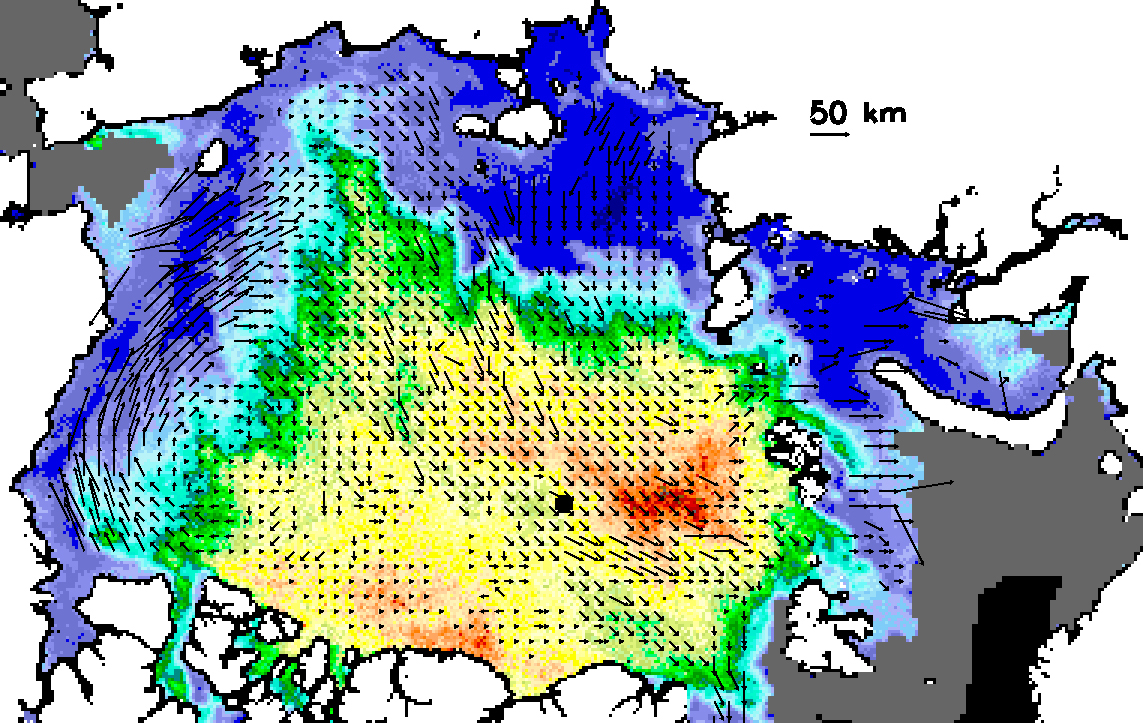
For several years the CERSAT has been providing sea ice maps derived from various scatterometers (microwave radar) on board earth observation satellites (ERS-1, ERS-2, ADEOS-1 or QuikSCAT). This instruments initially designed for measuring winds at the ocean surface allow to detect both the edge of the ice pack and the nature of the ice which it is made of (first-year, old ice, ...). A correlation analysis technique between successive maps is used to determine the movements animating this sea ice, mainly under the effect of the winds.
Image of the ice drift through a 3 day period, from 2000, April 30 to May 3. After the summer melt and the autumn frost, the sea ice properties are altered and the backscattering coefficient in increased. This backscatter map shows the different ice types. In purple is colored the first year ice and, from blue to red, the multi-year ice. Added to the backscatter images, the ice displacement vectors allow us to estimate the drift of the whole arctic pack. We can observe the gyre in the Beaufort Sea, offshore of the Canadian and Alaskan coasts as well as the ice flux leaving the Arctic Ocean through the Fram Straight, between Greenland and the Svalbard archipelago. No processing is undertaken on the black area. The grey area caracterizes open water.
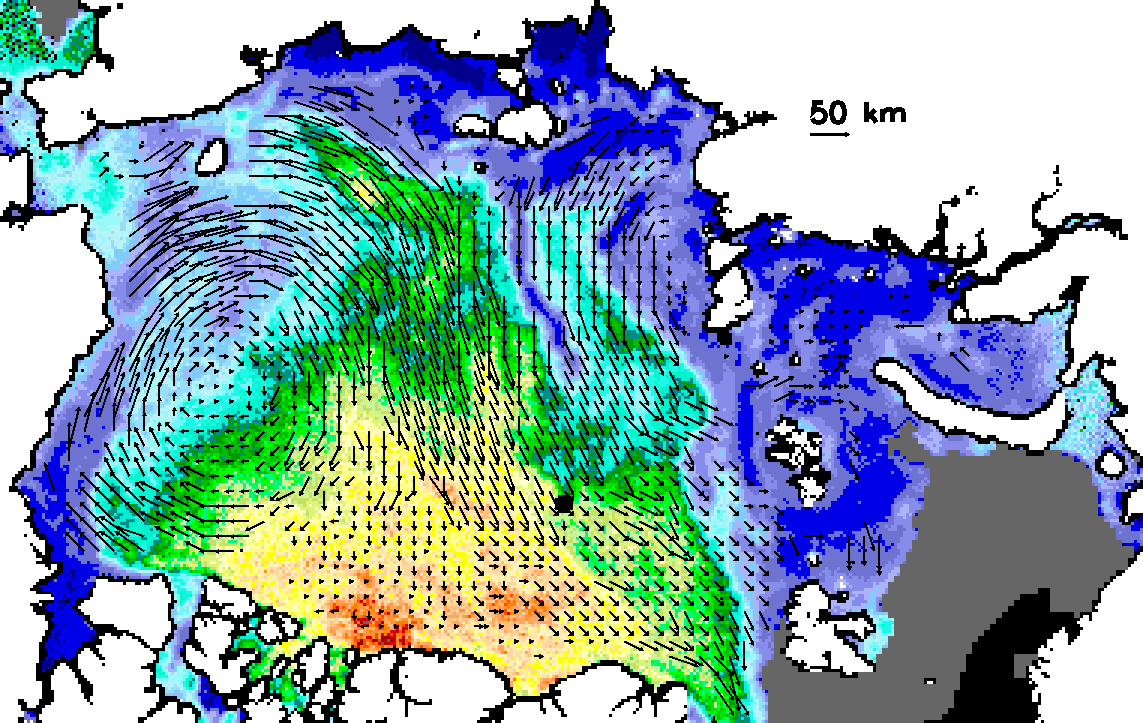
Image of the ice drift through a 3 day period, from 2000, November 20 to November 23.