Practicalities of Implementing Maximum Cross-Correlation
Some of the challenges in implementing maximum cross-correlation (MCC), and of how to validate the recovered velocity estimates.
Introduction
The idea of inferring the movement of water from successive satellite images seems both simple and intuitive, but a routine implementation of such a technique is challenging. Conventional techniques consider a small region of one image showing a characteristic feature and aim to locate the same feature in a later image, typically using a metric such as maximum cross-correlation (MCC). MCC computes the correlation between values of data in the sub-frame of the first image ('the target') with the values in all likely sub-frames in the second image, and it assumes that the position of the sub-frame with the highest correlation represents the true movement of the water between the two images. The advent of GOCI data from a geostationary satellite viewing the Korean peninsula offers a great opportunity to evaluate this technique. This is because it provides high-resolution (500m) multi-spectral imagery 8 times a day. Here we recap on some of the challenges in implementing such a technique, and of how we validate the recovered velocity estimates.
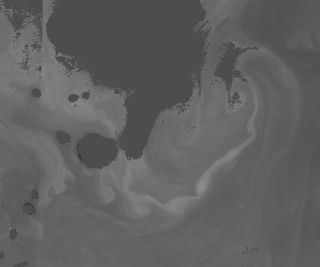
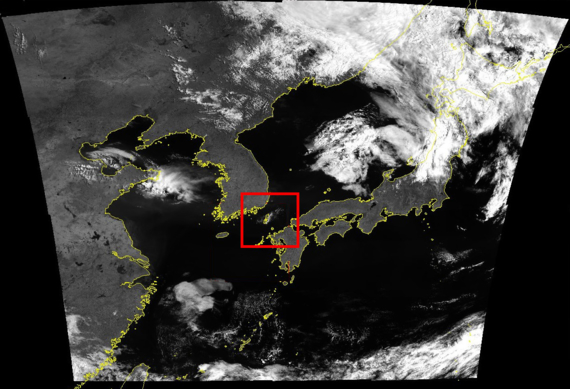
Five hourly GOCI images, showing the evolving pattern of chlorophyll. (Image size is 160km x 130 km, and covers the region between South Korea and Japan highlighted by the red box in right-hand image.)
Problems
1. Poor geolocation of data - early attempts at the MCC technique suffered from limited orbit predictions such that the co-ordinates of ocean features were poorly known. We have compared the supplied data with a coastline database and have determined that this is not a problem for GOCI.
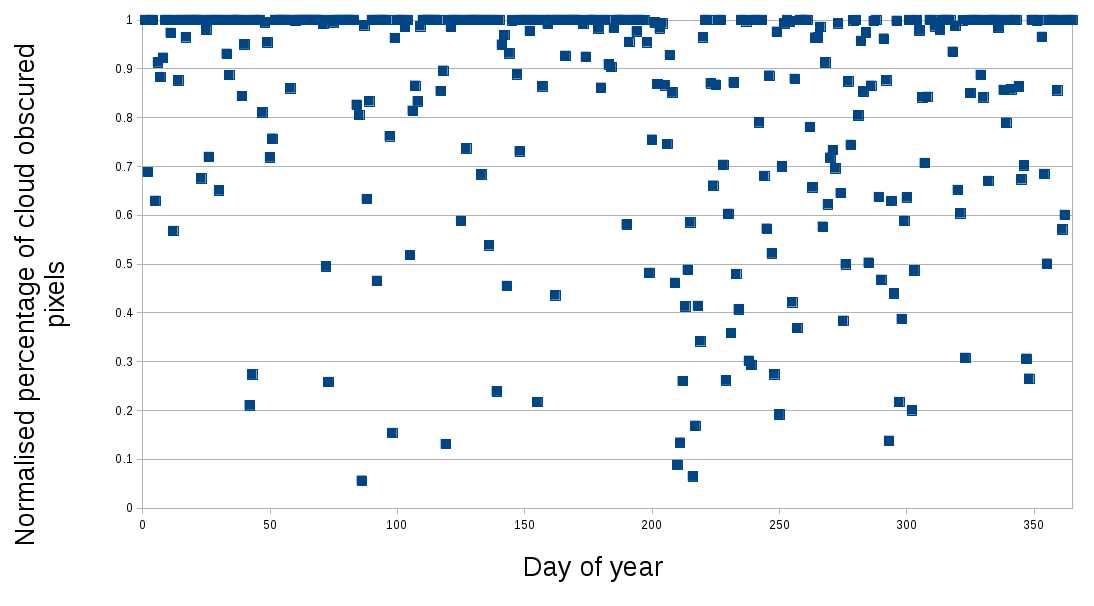
2. Visibility of features - If a region is cloud-covered in either of the images, no useful information can be returned. A second problem occurs if the region is homogeneous with no distinctive features to track.
3. Evolution of features - The standard technique assumes the feature is simply translated with the current. To resolve such movement to an acceptable accuracy requires the feature to have moved several pixels between scenes, thus requiring a long time interval. However too long an interval may allow rotation of feature or deformation, especially shear when near to the coast. Additionally neither ocean colour nor thermal infra-red is recording a conservative property, as sediment may sink, phytoplankton grow and die, and the skin temperature be affected by mixing or heat loss to the atmosphere.
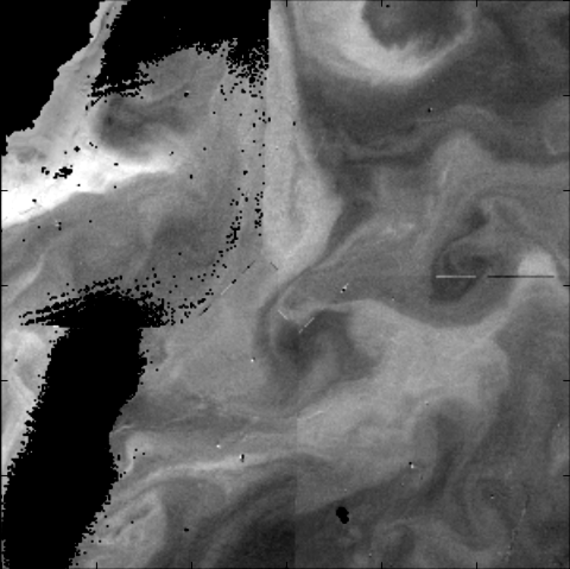
4. Presence of instrumental aretfacts - The existence of spurious features associated with the optical assembly of the instrument can affect the implementation of the MCC technique. The GOCI sensor synthesises its full 2500 km X 2500 km view from an array of 16 slots that it observes sequentially. There can be some movement of features between viewing of neighbouring slots, but a greater problem is the change in stray light pathways between these viewing geometries, leading to sharp linear features in the images.
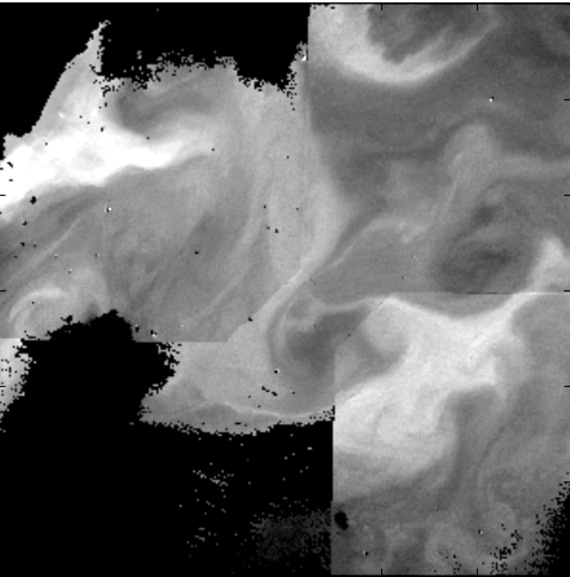
Three images of the same region during a single day showing that the border between neighbouring camera 'slots' is marked by both discontinuities in features and changes in cloud masking. These borders are not straight across the whole image (see especially 3rd image) and move (presumably corresponding to changes in pointing of satellite sensor).
Progress
i) Simulations indicated that MCC performance would be optimised if the size of the template was chosen to match that expected for the features in that region. Consequently we adopted a target image of 44x44 pixels i.e. ~22 km in width. This is commensurate with the size of features within the narrow strait where our validation data lie.
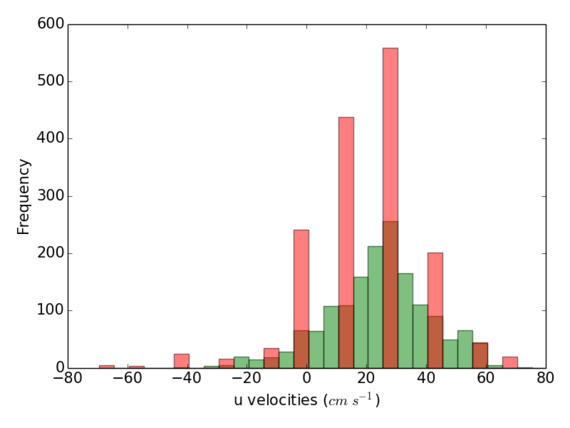
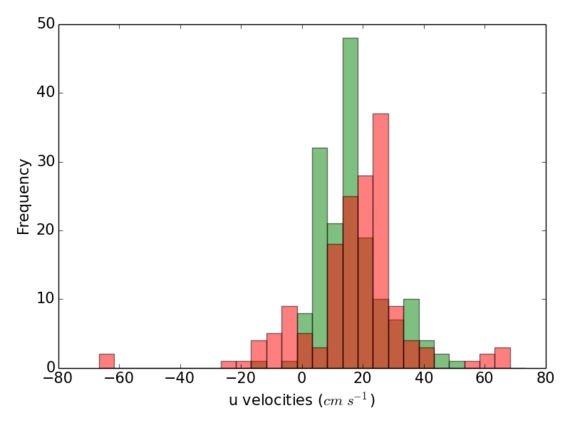
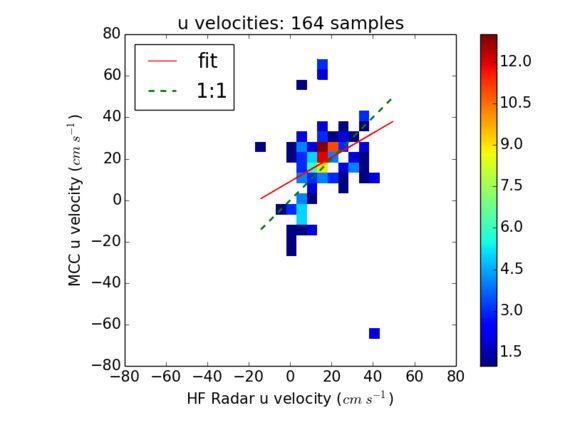
ii) If the images utilised are only one hour apart, then the minimum speed that can be resolved is 500m/hr (which is ~14 cm/s). We thus found that time separations of around 5 hours were much better, providing greater precision in the speed, and permitting velocity directions other than the 4 cardinal points.
Histogram of eastward velocity component from MCC (red) & HF radar (green) for a) 1 hour separation, and b) 5 hours.
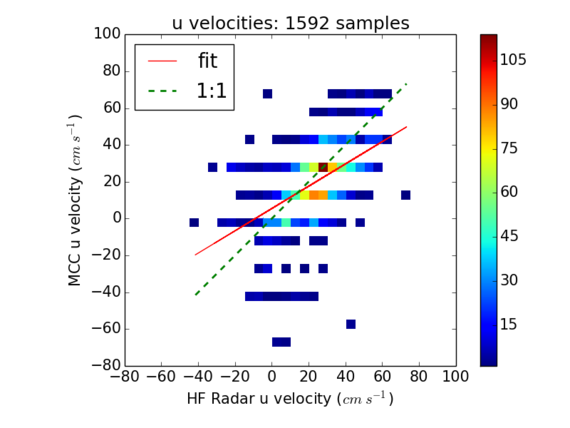
iii) Patchy cloud cover is a significant problem in the Tsushima Straits region where we have our validation data from the HF radar system. If we only consider images that are less than 20% cloud, then the r.m.s. errors in the velocity components are ~20 cm/s. However there are few days with so little cloud.
Scatterplot of eastward velocity component from MCC and from HF radar network, with colour indicating no. of observations. a) 1 hour separation of images. b) 5-hour separation


