


Sea Surface Salinity measured from space for the first time !
 A new method was developed that combine C and X-band brightness temperature measurements over the ocean to retrieve for the first time salinity is from satellite microwave radiometer measurements. It provides a mean for monitoring salinity in the Amazon plume and it is very encouraging for future L-band radiometry from space.
Remote-sensing of the sea surface salinity
Sea Surface Salinity field measured from Space using C and X-band channels of the Advanced Microwave Scanning Radiometer - Earth Observing System (AMSR-E) over the Amazon and Orinoco freshwater Plumes region, for the month of August 2003. The black contour lines represent the levels of the colored dissolved organic matter (CDOM) absorption coefficient based on a monthly composite of SeaWiFS and MODIS products. CDOM is used here as an independent proxy for delineating the spatial extent and patterns of the Amazon and Orinoco freshwater plumes.
Ocean surface leaving microwave radiation is sensitive to a variety of physical and chemical parameters such as temperature and salinity as well as the sea surface roughness geometry and foam formation properties. The sensitivity of the emitted radiation to small variations of these above parameters is a function of frequency, probing angle and polarization state. Conceptually, microwave Sea Surface Salinity (SSS) measurements can thus be performed, given a sufficiently sensitive electromagnetic wavelength, when the Sea Surface Temperature (SST) and surface roughness information are known.
Sea Surface Salinity field measured from Space using C and X-band channels of the Advanced Microwave Scanning Radiometer - Earth Observing System (AMSR-E) over the Amazon and Orinoco freshwater Plumes region, for the month of August 2003. The black contour lines represent the levels of the colored dissolved organic matter (CDOM) absorption coefficient based on a monthly composite of SeaWiFS and MODIS products. CDOM is used here as an independent proxy for delineating the spatial extent and patterns of the Amazon and Orinoco freshwater plumes.
Sea Surface Salinity field measured from Space using C and X-band channels of the Advanced Microwave Scanning Radiometer - Earth Observing System (AMSR-E) over the Amazon and Orinoco freshwater Plumes region, for the month of August 2003. The black contour lines represent the levels of the colored dissolved organic matter (CDOM) absorption coefficient based on a monthly composite of SeaWiFS and MODIS products. CDOM is used here as an independent proxy for delineating the spatial extent and patterns of the Amazon and Orinoco freshwater plumes.
Ocean surface leaving microwave radiation is sensitive to a variety of physical and chemical parameters such as temperature and salinity as well as the sea surface roughness geometry and foam formation properties. The sensitivity of the emitted radiation to small variations of these above parameters is a function of frequency, probing angle and polarization state. Conceptually, microwave Sea Surface Salinity (SSS) measurements can thus be performed, given a sufficiently sensitive electromagnetic wavelength, when the Sea Surface Temperature (SST) and surface roughness information are known.
Based on such measurement principles, low frequency microwave radiometer sensors onboard the ESA's Soil Moisture and Ocean Salinity (SMOS) and the NASA Aquarius missions will provide in the near future the first measurements of sea surface salinity dynamics at global scale from space, with an expected resolution of the order of 0.1 psu (practical salinity unit). The frequency window at 1.413 GHz (L-band, wavelength of 21 cm) where SMOS and Aquarius sensors will operate, is an optimum choice for remote sensing of salinity and is very near the peak in sensitivity of microwave brightness temperature (Tb) to changes in salinity. The spaceborne passive remote sensing heritage at such frequency is however very limited, with only several days of data acquired in 1973 and 1974 from the Skylab S-194 radiometer (Lerner and Hollinger,1977).
Therefore, most salinity inversion research conducted to date to prepare the coming salinity missions has focused upon L-band field studies and theoretical investigations.
Here, we investigate if existing ocean satellite data at the lower end of the present day passive microwave frequency spectrum (C- and X-band on AMSR-E, Windsat or TMI), having significantly lower SSS sensitivity than at L-band, can nevertheless offer an opportunity to evaluate salinity inversion budget issues; this using on-orbit data with temporal and horizontal resolution scales in line with the coming missions. Using the C (6.9 GHz) and X (10.7 GHz) -band channels of the Advanced Microwave Scanning Radiometer - Earth Observing System (AMSR-E), our study demonstrates the feasibility of retrieving salinity in a very contrasted region (the Amazon and Orinoco freshwater Plumes region), for the year 2003.
The methodology and demonstration is described in detail in Reul et al., 2009. To compensate for the weak sensitivity at C and X-band, our study is limited to the Amazon plume region in the Northwestern Tropical Atlantic characterized by large (100-200 km) and persistent salinity contrasts that exceed the 0.1 psu salinity science mission requirement by a factor of 10-100, and by warm surface waters.
Demonstration over the Amazon plume
Cartoon depicting the major upper-ocean circulation features in the western tropical Atlantic. The South Equatorial Current (SEC), North Brazil Current (NBC), and North Equatorial Countercurrent (NECC) close the wind-driven equatorial gyre. NBC rings provide a mechanism for mass and tracer transport from this gyre through the tropical gyre and into the southern extent of the North Atlantic subtropical gyre. (Figure from Fratantoni, D.M., and D.A. Glickson, 2002)
This region is of great importance within the salinity mission context due to the large freshwater flux from the discharge of the Amazon and Orinoco rivers, and their interactions with northward propagating eddies 58 from the retroreflection of the North Brazil Current (NBC).
AMSR-E SSS estimates were then validated using a complement of sources. Recent ocean color work (e.g., Hu et al. [2004]) demonstrated the strong negative correlation between satellite-derived colored dissolved organic matter (CDOM) and the surface salinity in the Amazon plume region. To support spatial validation in this study, composite of SeaWiFS and MODIS products are used to produce CDOM maps as a proxy for delineating the spatial extent and patterns of the Amazon and Orinoco freshwater plumes. In addition, both a climatology (Reverdin et al. [2007]) and a match-up data base between in situ upper layer salinity measurements and AMSR-E estimates are used for quantitative evaluation.
The results for each month of the year 2003 are shown below.Each set of figure for each month has 4 subplots ( click on images for a bigger size plot). Subplot (a) is the monthly averaged difference in estimated flat sea surface brightness temperature between 6.9 and 10.7 GHz frequencies in vertical polarization, (b) is the corresponding monthly averaged AVHRR-AMSR OI 0.25° sea surface temperatures, (c) is the monthly composite map of the colored dissolved organic matter (CDOM) absorption coefficient obtained with the GSM model and the SeaWiFS and MODIS sensors and (d) is the monthly averaged sea surface salinity retrieved from AMSR-E. The black contour lines on each figure represent the levels of the CDOM absorption coefficient, used here as an independent proxy for delineating the spatial extent and patterns of the Amazon and Orinoco freshwater plumes.
15-days averaged grids are also available as NetCDF files on CERSAT FTP server.
As seen in the figures, the extent and dispersal patterns of the Amazon and Orinoco freshwater plume seen by AMSR-E is very well correlated with the highly colored waters througout the year, as indicated by the superimposed CDOM absorption coefficient contours on the SSS maps.
Validation with in situ data
To demonstrate that AMSR-E retrieved SSS products contain enhanced information with respect to climatologies, we develop a match-up data set between AMSR-E bi-monthly averaged SSS estimates and in situ data provided at the French Coriolis Argo Data center. The in situ data originate from different sources such as profile data (selected at the uppermost level located between 5 m and 10 m depth), with the addition of underway collection on research vessels and voluntary observing ships (VOS), and from moorings in the tropical Atlantic (PIRATA array). The monthly SSS climatology of the tropical Atlantic developed by Reverdin et al. [2007] and generated at a spatial resolution 1°x1° is also used in the present work.
Comparison with measurements of voluntary observing ships
Voluntary observing ships (VOS), equipped with thermo-salinograph, performed SSS measurements along several transects in the area during 2003, collecting seawater at about 5 m depth. Here, we show several examples of the SSS measured by the ships together with the 15 day-average retrieved AMSR-E SSS interpolated along the transect.
| |
|
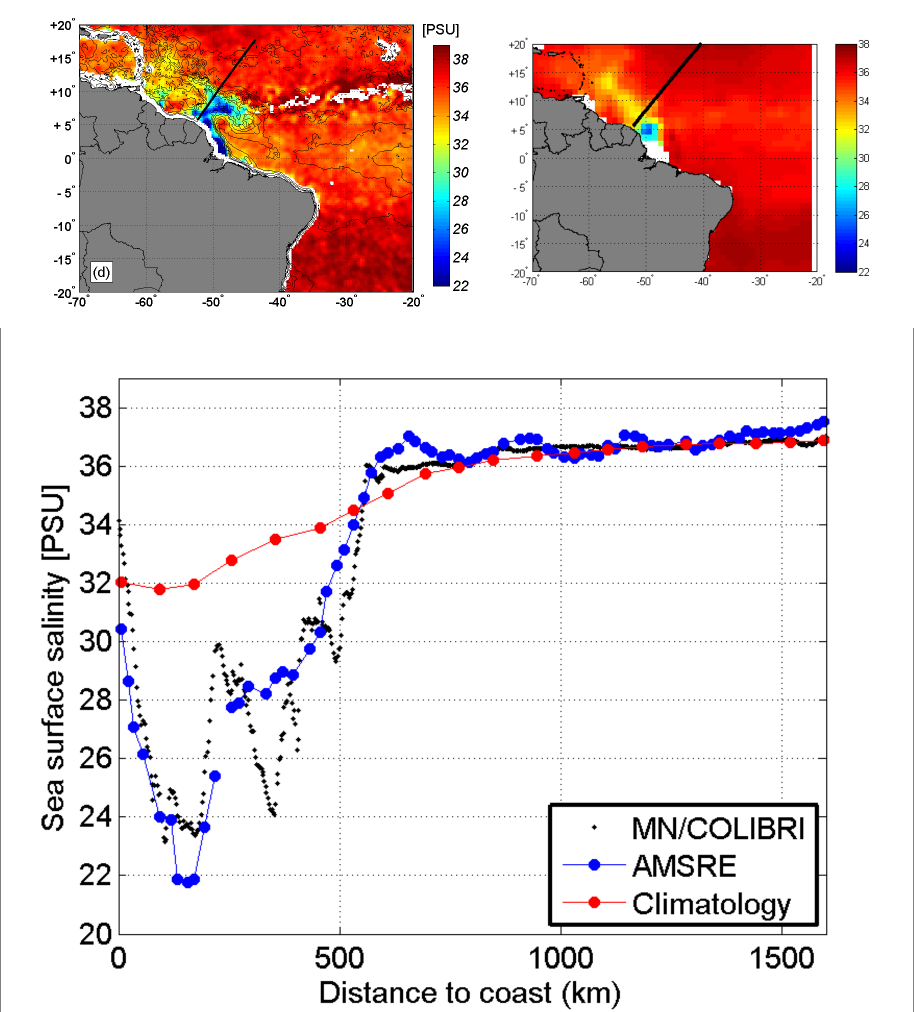
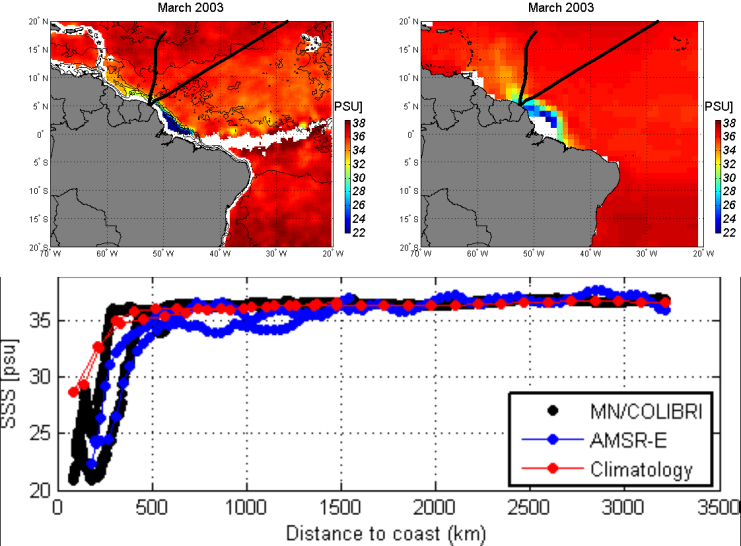
In general, we found that the large-scale spatial structure of the freshwater Amazon plume, extending from about 200 to about 600 km offshore depending on the season, is clearly observed in the AMSR-E SSS product. On the other hand, the climatology often underestimates the salinity gradient across the plume. Local discrepancies between the satellite and in situ SSS are nevertheless observed at scales smaller than about 100 km.